I first coached this kid when he was throwing 40-44mph in rec ball. He was maybe ten years old, learning to grip a baseball properly, figuring out what his arm was supposed to do. Now he’s an 8th grader who just made the high school roster, sitting on 60+ mph on his four-seamer.
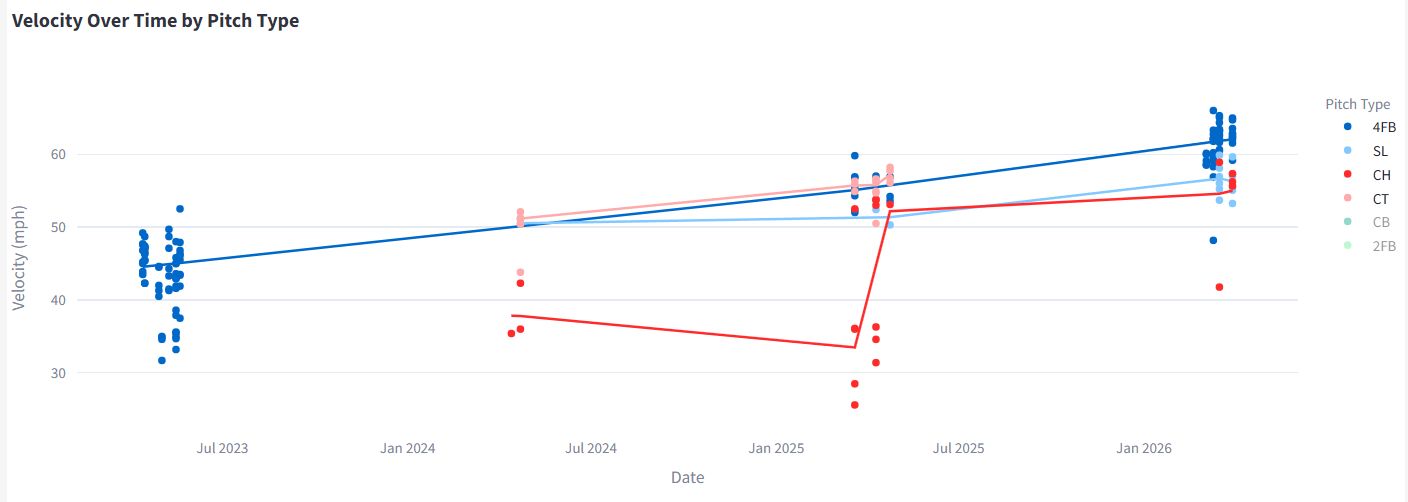
Twenty miles per hour in three years. That doesn’t happen by accident.
It happens through consistent work and honest feedback — the kind where you actually look at what the ball does after it leaves his hand, not just whether it ended up where you wanted it. It happens because this kid has always been coachable, and because the people around him have cared enough to pay attention over time.
But here’s something I almost couldn’t show you.
The silo problem
His early sessions ran through PitchLogic. His more recent work has been on Rapsodo. Two different tracking systems, two separate data sets, neither one designed to talk to the other. Each system is good at what it does in isolation — but neither one can show you a three-year velocity arc. Neither one can tell you whether his movement profile has matured alongside his velocity. Without a way to pull those silos together, the chart at the top of this post doesn’t exist. You have snapshots. You don’t have a story.
This is more common than people realize. A kid pitches at one facility in the fall, another in the spring, uses one tracking system at a showcase and a different one at his home field. Every session generates data. Almost none of it follows him anywhere.
What the data actually shows
Velocity is the headline, but it’s not the whole story. What I care about as a coach is whether his development is coherent — whether the pitches he throws are moving the way we intend, consistently, from session to session.
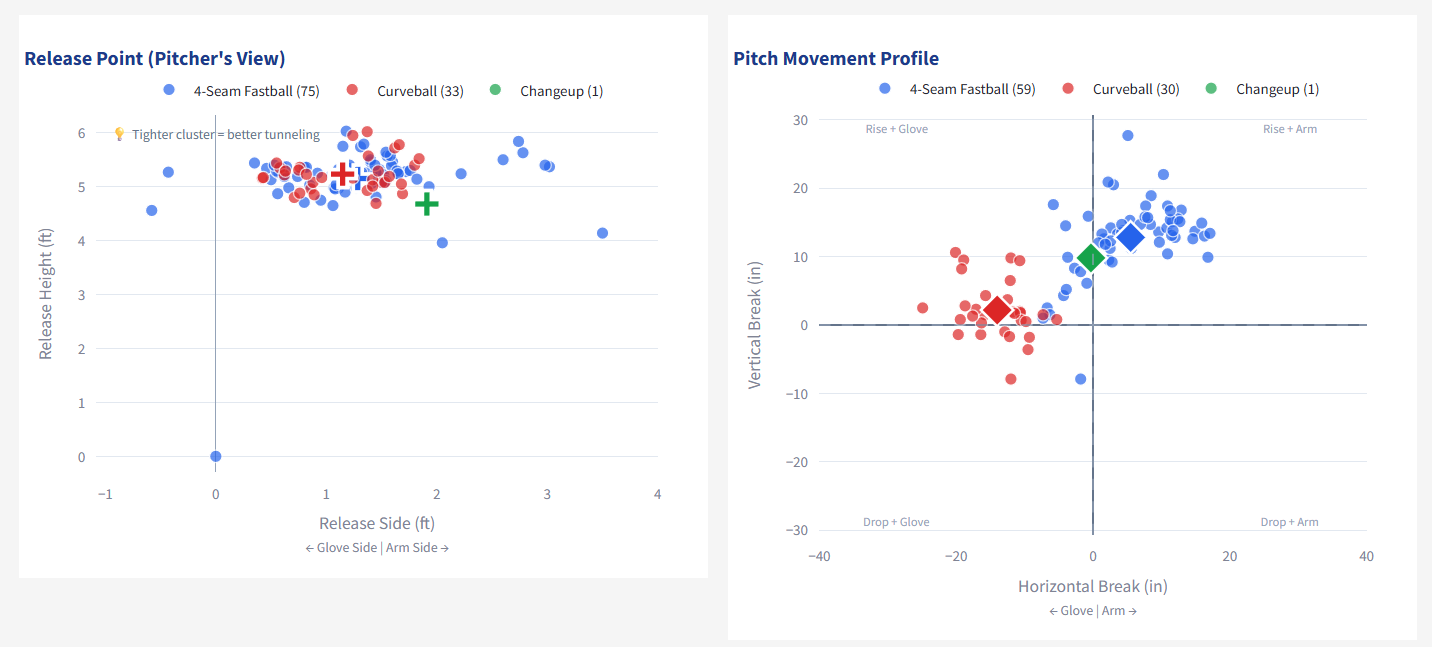
That means looking at movement consistency: how much does the actual shape of his fastball vary across a bullpen session? Not relative variation as a percentage of the mean — what matters to a hitter is actual variation in real units, inches of movement, degrees of spin axis. A pitch that varies three inches horizontally is three inches of unpredictability, regardless of how much it moves overall.
It also means looking at tunneling — how similar do his pitches look to a hitter through the first 20 feet of flight before they diverge? Velocity gets you into the conversation. Tunneling and movement consistency are what keep hitters uncomfortable.
These aren’t things you can eyeball from the mound. They’re things the data tells you, session over session, if the data is actually connected.
What comes next
At the current trajectory, this kid projects to mid-80s by the end of high school. Nothing is guaranteed — progress is never perfectly linear, and bodies and mechanics evolve in ways that charts can’t predict. But the data gives us a foundation to work from. It gives him something to own and carry forward, regardless of what facility he walks into next or what coach is standing behind the mound.
That’s what I built DiamondMetrics to do — make a player’s development record as portable as he is. Not a snapshot. A passport.
If that problem sounds familiar, I’d be glad to talk. I’ll be at the Buying Sandlot Summit in Philadelphia next week — find me there, or reach out any time at diamondmetrics.net
