One of my players trained at three different facilities last year. Rapsodo sessions at one place, PitchLogic at another, some Trackman work at a showcase. He played on four teams with game data (a spring and 2 fall school teams, plus a summer travel team). He’s got other health and strength metrics in various apps. By December, his development story was scattered across six different logins, five different dashboards (no combined game data dashboard), and six different formats. He has even more if we start looking at his hitting.
Sound familiar?
This is the reality for most families in travel baseball. You’re investing serious money in player development, and the data that documents that development — spin rates, velocities, movement profiles, progress over time — lives in silos you don’t control.
The Tension Nobody Talks About
Here’s the uncomfortable truth: the facilities and technology vendors who create this data have little incentive to make it portable. Their business models reward stickiness. If your data lives in their system, you keep coming back to their system.
I don’t say this to vilify anyone. These are businesses, and businesses need to survive. But it creates a tension that families bear the cost of.
Facilities have the money to invest in tracking technology and analytics platforms. Families need the portability to maintain continuity as players move between facilities, change geography, or simply want to see their full development arc in one place.
Who funds it versus who owns it — that’s the question nobody’s answering clearly.
What If We Treated Player Data Like Medical Records?
Think about how healthcare handles this. Your doctor creates your medical records. The provider generates the data, maintains the systems, employs the staff. But you, the patient, have portability rights. You can request your records. You can take them to a new provider. Your history follows you.
The provider funds the creation. The patient owns the portable artifact.
What would this look like in baseball? A facility invests in Rapsodo, employs coaches who run sessions, pays for the analytics platform. During the time a player trains there, data aggregates into something useful. But when that player moves on — to a new city, a new facility, or just a different phase of their development — they take their history with them.
The next facility can add to that history. The player never loses what they’ve accumulated.
What This Means for Facilities
Some facility operators might read this and think: why would I pay for something that helps players leave?
But consider the alternative framing: you’re not paying for lock-in. You’re paying to be the place that gave families something valuable they’ll remember.
In a market where every facility has the same Rapsodo machines and runs similar programming, the ones that differentiate will be the ones that think beyond the transaction. Families talk. The facility that treated their data as belonging to them — that’s a story worth telling.
Where This Goes
I don’t have all the answers here. The economics are genuinely hard. Tracking system vendors need revenue models that don’t depend on data captivity. Facilities need value propositions that survive player mobility. Families need something that actually works without requiring a computer science degree.
But I think the medical records model points in a useful direction. Provider creates, patient owns. Funder and owner don’t have to be the same.
The families investing in player development deserve to see the full picture of that investment — not fragments scattered across a dozen logins they’ll eventually lose access to.
I coach high school baseball in western North Carolina and think way too much about data and player development. If you’re a facility operator or technology vendor working on this problem, I’d love to hear how you’re approaching it.
As I dive deeper into data, the one thing I become more convinced of is that consistency is the most important thing for a pitcher. If you can get your delivery to be consistent, you’re going to be able to reliable put the ball where you want to. The most important thing in pitching is throwing strikes, and consistency makes that easier.
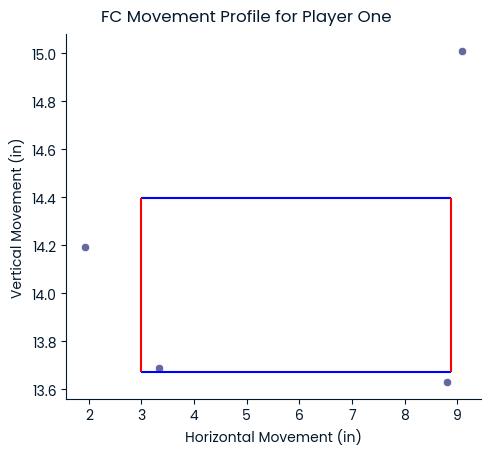
So, Sean and I had a bullpen with one of our guys this week. I got PitchLogic data on his pitches and I pushed it into the Python visualization code I’ve been working on. Among the charts it creates is one for movement by pitch type. On that chart, it creates a box that’s where about half the pitches would be if he threw with this consistency. So, for some players and some pitch types, it can be very large and for others, very small.
For these four-seam fastballs, that box is about 4 square inches. You can see most of his pitches are near it and a third of them are in it.
If Player One can get all of his four-seam fastballs to move 15 to 17.5 inches vertically and around 8 to 9 inches horizontally, he’s going to be consistently hitting his aim point.
Our goal isn’t for all of our pitches to put their pitches in his box, but, rather, that he consistently throws his four-seams this way. If he does, he can change his aim point and dominate hitters.
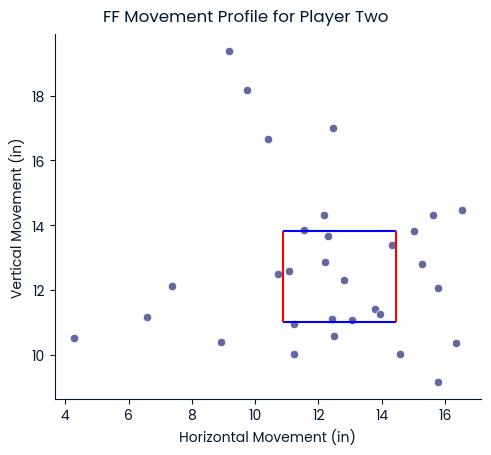
Every player is going to have a different box. Here’s a younger player whose box is about 10 square inches. As he gets more consistent, there will be fewer outliers and his box will get smaller (and he’ll throw more strikes).
I’ve only recently come up with this box – so recent that I don’t even have a name for it. It’s from the inter-quartile range of the movement data, so I could call it the IQR box, but that would get everyone asking why it’s called that instead of what it means and how it’s used. Maybe I could call it the MCB – Movement Consistency Box?
The PitchLogic ball auto-tags the pitches by type. I love this because it points out when players are not doing what they intend (throwing a cutter when they want to throw a fastball) or when they are mislabeling their pitches (throwing a cutter but calling it a fastball). The unintended variety tend to be younger players, while the mislabeling tends to come from high school players.
For our bullpen the other night, four pitches go auto-tagged as cutters. All four would have been down and to the left of the MCB for his four-seam fastballs. So, these wouldn’t have gone where he thought they would go. He also lost velocity on each of them. So, that high, hard inside pitch ends up slightly slower and out over the plate. Yikes!
Is it due to incorrect grip? Or a bad release? Is it lack of pronation? I honestly don’t know, but I know it’s something we’ll investigate and work on. I also need to check location on these pitches – time to get back to the code!
I’m not including any of the visualization posts in the Coaching Courses because they don’t really fit. They’re a bit esoteric and not really what you need to start coaching. It’s fascinating stuff, though.
I’ve been dumping my PitchLogic data into spreadsheets and manipulating it in HCL Notes databases, but I wanted to see some ‘visualizations’ to evaluate the data a little better. A picture is worth a thousand words, right? Or it “a pitcher is worth a thousand words”?
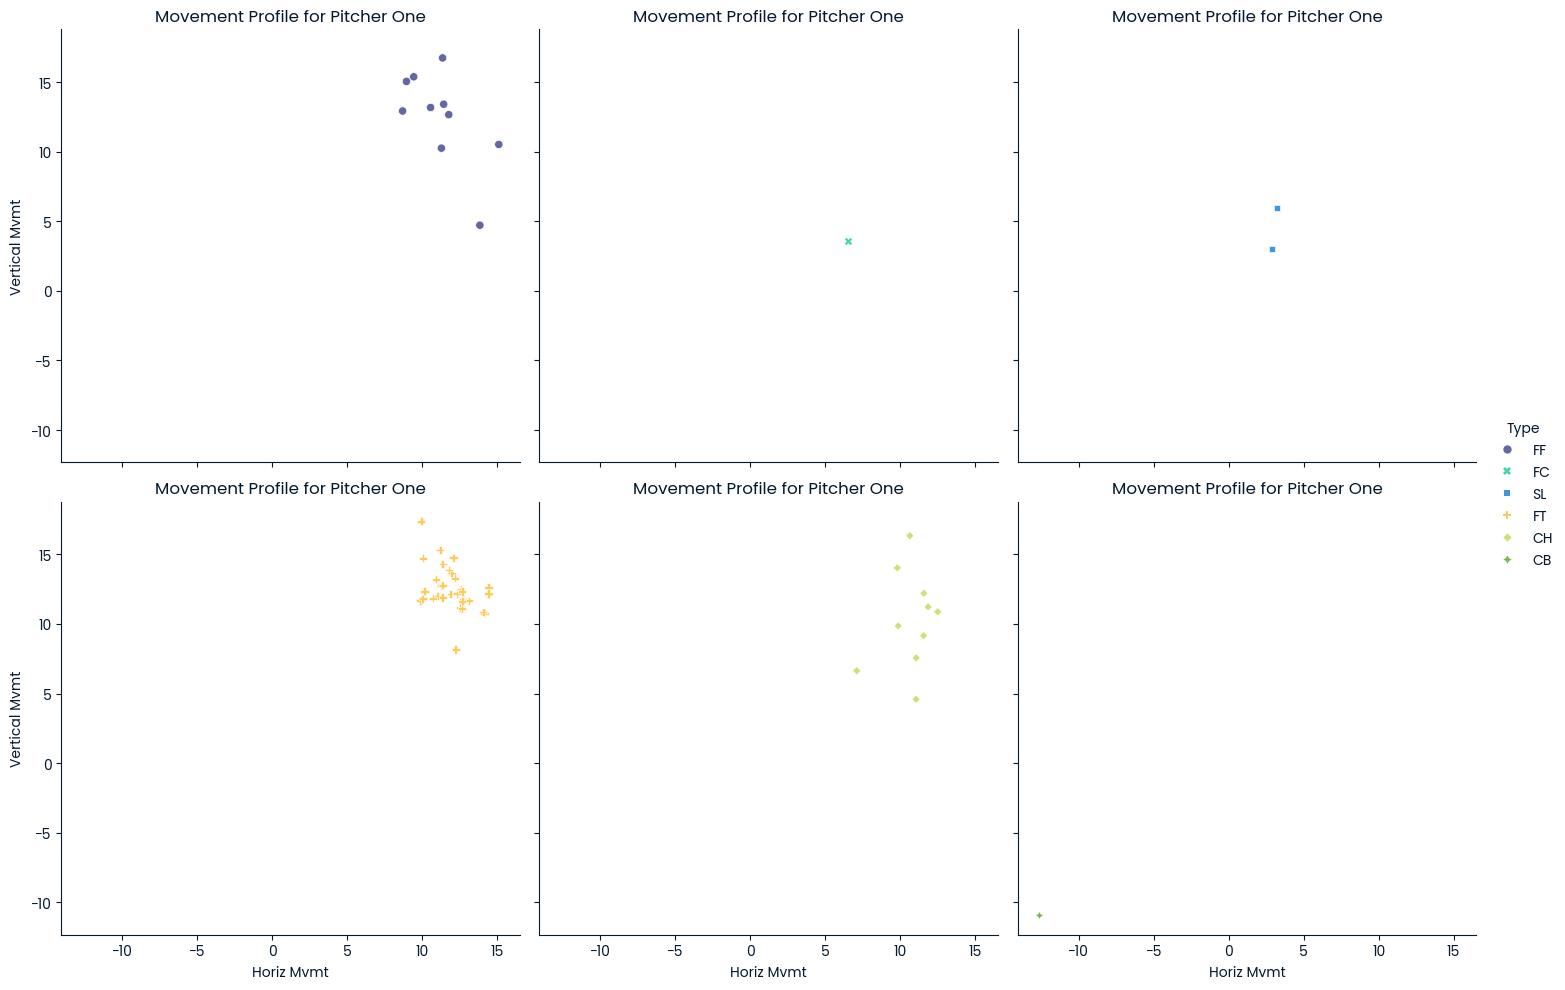
Within the PitchLogic app, you can get the vertical and horizontal movement for a single session. When you go look at your session reports, you see a little more. So, I’d used ChatGPT to help me create some visualizations from my downloaded data. Here’s a sample, showing those movement profiles by pitch type. This is only from about 50 pitches, so it looks interesting, but is a little less-than-actionable.
Now, that gives a very good visual impression of where the pitches are going. Fortunately for us, this is our hardest throwing pitcher and we’re going to have him for two more years. One of the things that pops out about this is that he’s missing high (1-2-3) more than he’s missing low (7-8-9) with 34% of his pitches being high and just 6% being low. Oddly, in this sample, nothing inside or outside at strike zone height. That could be just because it’s a small sample or might point out bad data collection (we might be categorizing those inside and outside pitches as high or low as well.)
The good thing is that I can also break this down into different pies for each pitch type, but the lack of data doesn’t make that real useful right now. When you have it, it can really bring home what the quality of the pitches really is.
I learned something new as well. I might have seen a boxplot a few times, but I never understood them. This uses statistical methods to place the velocity of the various pitches he’s thrown. Now, you must keep in mind that these are to auto-tagged pitch types. For any of you who are coaching young teens, you’re going to notice that how the PitchLogic ball tags the pitches is not always what the player intended to throw.
I’ve been telling other coaches that one of the things we need to work on with youth players is “grip discipline”. Most of them grow up with no instruction in how to grip the ball at all. Sometimes, they get instruction in how their fingers ought to be aligned, but rarely do they get instruction in how to line up the laces and their fingers the same every time. When I first started coaching Little League, I sent a Dad out to the mound to talk to our pitcher. He came back and said, “He was holding the ball with three fingers!” That was when I first realized that a lot of Dads and assistant coaches also need coaching and instruction.
Technology, and the PitchLogic ball in particular, give us a lot of numbers. As any old baseball guy will tell you, the only number that actually matters is balls and strikes. I don’t focus on how to improve those myriad numbers, like a player’s spin rate or velocity. The goal is consistency since moving the ball in a consistent way makes it easier to throw strikes. So, we look at how consistent is the arm slot, or whether the release makes it a cutter instead of a fastball. Then, we use the numbers as a gauge for ‘how consistent’ the pitches are.
How can you do this?
If you have a PitchLogic ball, you can get your data. Just go to the “hamburger” down in the lower left in portrait mode or upper right in landscape mode and then click on “Get CSV Data”. This will let you pick the dates for which you want data and then email you a file. You can drop it into ChatGPT and start asking it to make you some visualizations.
I plan on writing about the technical details on my software development blog, so for those who love that stuff, revisit here in a few days for a link!
Here in Asheville, we have lost some time that we had intended to use as an on-ramp to velocity improvement. The hurricane devastated many towns and neighborhoods in our region, but we expect to be back underway in the next few months. Many of the local fields have been badly damaged, so we will likely have to improvise and travel more than we would normally.
As such, we plan on offering an on-ramp program to local high school players to get them ready for their tryouts and spring seasons. The greatest hazard to a young arm when looking at high school teams is that you’re trying to impress the coach on Day 1. Without a proper on-ramp, you could quite easily start the season with an injury. The best preventative method is to on-ramp yourself in the 4 weeks prior to those tryouts. For this, we turn to the Driveline Skills that Scale: The Complete Youth Baseball Training Manual.
We’re a twice-a-week team practice group, usually doing our practices on Mondays and Thursdays. This fits well with our plans for an On-Ramp, Powered by Driveline. The first practice date for NCHSA in 2025 is Wednesday, February 12th. So, we need to walk back four weeks, finishing on Monday, February 10th. Thus, we start on January 16th. That fits well with the ABCA Convention on January 2nd to 5th in Washington, DC.
Equipment
For the on-ramp, each player ought to have their own set of equipment or share it with a partner. This way, they can bring it to both team practices and do two other practices with that partner each week.
Recovery: This is our most common workout, used to get us started and repeated in between team workouts. It’s about 50 throws and should never exceed 50% intensity.
J-Bands: 10 of each of the 8 exercises (download PDF here)
Forward & Reverse Flys
Elevated Internal and External Rotations
Tricep Extensions with Pronation
Bicep Curls with Supination
Wrist weights: 10 of each of the 4 exercises (PDF here)
Pronation Swings (Spill the Cup)
Two Arm Throws
Cuban/Gorilla Press
Pivot Pickoff
Training
Plyo Reverse Throws: 10 each with Blue (450g) and Green (1000g)
Plyo Pivot Picks: 10 each with Blue (450g) and Red (225g)
Catch play: 30 throws with baseball, not to exceed 50% intensity
Hybrid B: In our on-ramp, this is actually the most common team workout. It’s basically double the workload of the Recovery workouts, with a bit more intensity — 70%. This is used to slowly ramp our arms up to the intensity we’re going to need for regular practices, bullpens and games. Driveline labels it “Hybrid B”, so we’ll stick with that, even though it is the most common workout in all Driveline youth throwing programs. Somewhere between 90 and 120 throws, up to 70% intensity
Warm Up
J-Bands: 10 of each of the 8 exercises
Wrist weights: 10 of each of the 4 exercises
Training
Plyo Reverse Throws: 10 each with Blue (450g) and Green (1000g)
Plyo Pivot Picks: 10 each with Blue (450g) and Red (225g)
Plyo Roll Ins: 10 each with Red (225g)
Plyo Step Backs: 2 each with Red (225g), Yellow (150g), and Grey (100g)
Plyo Walking Windups: 2 each with Red (225g), Yellow (150g), and Grey (100g)
Long toss: 40-70 throws with baseball, building to 70% intensity (check Long toss distances, keeping that 70% in mind)
Hybrid A: This is the most intense workout of the On Ramp, so we just do it once, near the conclusion of the cycle. Total throws are still 90 to 120, but our intensity can go up to 90%.
Warm Up
J-Bands: 10 of each of the 8 exercises
Wrist weights: 10 of each of the 4 exercises
Training
Plyo Reverse Throws: 10 each with Blue (450g) and Green (1000g)
Plyo Pivot Picks: 10 each with Blue (450g) and Red (225g)
Plyo Roll Ins: 10 each with Red (225g)
Plyo Step Backs: 2 each with Red (225g), Yellow (150g), and Grey (100g)
Plyo Walking Windups: 2 each with Red (225g), Yellow (150g), and Grey (100g)
Long toss: 20-30 throws with baseball, building to 90% intensity
Compression Throws: 5-6 throws with baseball, 90% intensity
Schedule
Sun
Mon
Tue
Wed
Thu
Fri
Sat
16 Jan Recovery with team
17 Jan OFF
18 Jan Hybrid B with team
19 Jan OFF
20 Jan Recovery with team
21 Jan OFF
22 Jan OFF
23 Jan Hybrid B with team
24 Jan OFF
25 Jan Recovery with partner
26 Jan OFF
27 Jan Hybrid B with team
28 Jan
29 Jan Recovery with partner
30 Jan Hybrid B with team
31 OFF
1 Feb Recovery with partner
2 Feb OFF
3 Feb Hybrid B with team
4 Feb OFF
5 Feb Recovery with partner
6 Feb Hybrid A with team
7 Feb OFF
8 Feb Recovery with partner
9 Feb OFF
10 Feb Hybrid B with team
11 Feb
12 Feb School team practices start
Get Training!
I’m very much looking forward to running this program in the new year and I’m sharing in hopes that others use it for their programs as well. Note that this program is the Driveline 13-14u program. The 9-12u program is a little less intense – 3 days instead of 4 (No Wednesdays) and no Green (1000g) plyo reverse throws. I heartily encourage everyone to purchase a copy of the Driveline Skills that Scale: The Complete Youth Baseball Training Manual. There’s loads more content like this as well as mentoring on how to coach, how to plan, and how to develop your players.
This is the start of a multi-post series on how to use a PitchLogic ball to coach youth pitchers.
How do I use the ball?
You’ve just put down a few hundred dollars to get the latest pitching technology. Your ball came in the mail and you’ve charged it up. Now what? Get familiar with using it yourself. Check the player app video to get the basics.
Once you understand how to pitch the ball and see the data, you can bring it to a practice. Pick a few pitchers to throw your first bullpens with the PitchLogic ball. Make sure that you schedule a minute per pitch – so if you want to have 6 pitchers throw 10 pitches, you need to have an HOUR after they’ve warmed up. That includes getting them ready, some time discussing how to use the PitchLogic ball, showing them some of the data and letting them know what they did well or need to work on. I always think I can get 2 pitches per minute, but it never happens that fast.
Arm Slot and Spin Direction
This is where you start using the tech to coach your pitchers. Trained eyes will pick up the arm slot and spin direction on every pitch, as well as be able to tell you when they vary. Trained eyes are rare in youth baseball, but by using the PitchLogic ball, you get the equivalent of those trained eyes on every pitch. For trained eyes, it also lets you quantify those values and track them over time.
Your first tendency is going to be to change the arm slot to what someone told you it should be. Unless the player struggles to throw at all, you should concentrate on getting them to be consistent with whatever arm slot they use. If the spin direction varies, work on their grip to get it to be more consistent. I’ve usually urged them to have arm slot and spin direction match up, as that is the most efficient. I even have a computed column on my spreadsheets that shows me the difference between the two. Nonetheless, consistency is how they learn to throw strikes.
When you start looking at that arm slot and spin direction, you should share it with the player. Often, the grip is the source of the difference in the two. I’ve coached a number of players who throw with a cutter grip, with their fingers not quite on top of the ball, with the ball sliding out that gap between finger and thumb. A cutter moves similarly to the fastball they’re emulating (2-seam or 4-seam) but not as much. If the player is already throwing that for strikes, you might want to keep that grip while trying to create a fastball grip. That would give them two pitches that are very similar but different enough to confuse hitters.
You might notice that we haven’t mentioned anything about pitch type yet. That’s because the arm slot should be the same for every pitch. What you do with the grip and your wrist is what makes all the difference.
As I continue my evolution as a coach, my use of my tools, especially the PitchLogic ball, in bullpens has gotten more refined and the quality of the training and the information gained has increased dramatically.
Several weeks ago, PitchLogic hosted a webinar for ABCA, “What Pitching Data Really Means & How to Use It at the High School, College and Professional Levels“. It was a terrific webinar that delved into the experiences of pitching coaches at all levels. Truly enlightening, but not as focused on using the technology as I’d hoped. So, as a step toward improving our own bullpens, I’ve decided to share out how we’re doing it. I suspect this will provoke feedback and allow an iterative process to improve this for everyone.
Our environment
I’ve implemented the use of technology in our practices and in in-game bullpens over the course of the last 4 years. The pitchers involved are probably significantly younger than most PitchLogic users, ranging from 10-year-olds up to 15-year-olds. Since I started in Virginia and moved to North Carolina, no individual player has been in the system for more than 2 years. In 2024, it will be the first time that more than 3 of the pitchers involved has been tracked for more than a year. In every case, I’ve been the only person with regular access to the data (and the only one who understood it for most of that time!) For most of the time, I was the head coach. The past six months, I’ve been just a pitching coach and more focused on the process and data. I’ve also started sharing the spreadsheets with one of the players who envisions a career in engineering, since it’s good to have another set of technical eyes on the data.
The tools
For our bullpen tracking, we’re utilizing the Smart Coach Pocket Radar, F5 Sports’ PitchLogic ball, my own bullpen tracking sheets, Microsoft Excel, iCloud Notes, and the apps for PitchLogic and Pocket Radar.
The SmartCoach Pocket Radar was the first piece of technology that I acquired to help me coach my pitchers. While some of the old men that I play with contend that it’s not accurate (they think they throw 75mph while in their 60s), it shows readings matching the stadium signs when we use it at minor league ballparks. It doesn’t read speeds below 25mph, but unless you’re coaching 9u, that won’t be a problem. The best use of this is in-game to track velocity. We use it in bullpens for immediate feedback on the pitches. This is the velocity that we record on the bullpen tracking sheets.
The PitchLogic ball provides the detailed feedback on your pitches, to the extent that it provides far more information than you can use at first. I’m up to using 9 of the 23 columns of data returned after using it for 4 years. At first, we only used velocity, spin direction and arm slot. Then, we added more as we understood the use of each and saw patterns in them.
During the bullpens, we use my own bullpen tracking sheets. Each has room for 20 pitches, which is our standard bullpen. (MLBs PitchSmart guidelines have 20 pitches in a game as the max for pitching the next day, without rest.) For every pitch, we record pitch type, velocity, and location. The pitch location gets marked with an X and for pitches with movement, we draw a line indicating how it moved. There is a spot for any notes on a pitch. At the end of a bullpen session, we take a photo of the bullpen tracking sheet for our records and hand the paper copy to the player.
The data that gets collected by the PitchLogic ball can be downloaded as a CSV file (comma separated variable) and opened in Excel. Over the course of a season, I dump all the data for my pitchers into a spreadsheet and then create tabs for every player. Each of the columns that I use has formulas in it for highlighting good and bad results. By reviewing player data over time, it’s easier to see their improvement and find areas that need more work.
After the bullpen, we upload the photo of the bullpen tracking sheet to the player’s Note on iCloud. This way, all bullpen tracking sheets are in the same place, easily accessible and comparable. Any notes on the bullpen get added, then game stats, commentary or notes on usage get added to the same note. This single location for data collection and commentary ensures that guidance, practice results and game results can be understood.
Coach ‘Em All
Since we’re coaching 13u and it was fall, everyone threw some bullpens, and several players caught them. We discovered a couple of pitchers we didn’t realize we had – one of whom threw a 4-inning, one-run “complete” game win. As a Little League coach, I started every season believing that had 12 pitchers on the roster and you had to prove me wrong. I also started every season with a one or two catchers and finished with four or five, since everyone had to catch some bullpens and some ended up liking it a lot.
By allowing everyone to throw bullpens, you can discover those unknown pitchers and work on the arms of your fielders directly, rather than as part of a broader drill. When you’re coaching kids, you can’t know their potential. You can guess, but you’re likely to be wrong. The USA 12u National generally only contains 1 or 2 kids who make the National team in high school. Early growth and early success do not necessarily lead to continued interest or success. The move from the 60’ diamond to the 90’ diamond ends the youth baseball careers of many young all stars.
Setting up for the Bullpens
Depending on the facility, we might have a full bullpen with two mounds and two plates, or we might have an open space at the field that we have to lay out ourselves. It’s good to have a hard pitching rubber and a throw down plate and your measuring tape (or pre-cut string) handy when you don’t know what you’ll get.
Probably the most important thing to keep in mind is what happens when the catcher can’t stop the ball. I’ve lost a PitchLogic ball in the underbrush and had players chase another down a hill. If you can have a backstop, net or 60′ of open ground behind the catcher, that’s good.
Initializing the PitchLogic Ball
Before the bullpen, connect your PitchLogic ball to whatever mobile device you prefer. We generally get the best connection and display of data on an iPad. Once connected, you need to select the pitcher in the PitchLogic app so that their data is stored properly and, if they have the app, shared with the player. Lary Sorensen of F5 Sports gives a good intro to using the roster.
Remember, for any throw to be recorded, the PitchLogic ball needs to be held stationary for a half second. This reminds players to “make sure you don’t balk”.
Sometimes, we have the camera on for the bullpen and sometimes not. Usually when we do, it’s on the arm side behind the player facing home plate. This allows visual feedback of the movement and location. Sometimes, we have used arm side, 3 quarters in front to provide a different view of the pitch mechanics. When video is used, it’s best to have the iPad or phone on a tripod to keep the video consistent and to allow everyone to focus on the pitcher.
Setting up the Pocket Radar
For bullpens, I usually do not launch the PocketRadar app to record the velocity of pitches or to do the video. Sometimes, there seems to be interference on Bluetooth when I try using both the PitchLogic ball and the PocketRadar. So, I either hold it in my hand, connect it to the fence or have it on a tripod, always behind the pitcher. When there are no problems hooking both devices up with Bluetooth, I’ll put it on a fence using a Nexus Mount – either behind the pitcher or behind the catcher.
The most critical accessory you can get for your PocketRadar is a Power Bank. Relying on the batteries in the PocketRadar itself is a recipe for disaster. When using the app or just running continuously, the batteries die quickly. Better to have the power bank or plug it directly into an outlet at the field. (Often, you can plug in behind home plate, but I’ve never run across at outlet at the bullpens where we’ve practiced or played.)
If you can use the app, it allows you to tag which player is throwing the bullpen. When I use the app with video during a game, I will usually tag the pitches after the game, removing throws from the catchers and hits. Since you can set the threshold for minimum velocity on recording, you can usually prevent the app from recording catchers’ throws. This season, we’re going to start using it with GameChanger when streaming the games.
I wish that I had an application that would create pitch video season collections online for each of my pitchers so that we could easily review that online. If I had employees or interns, they might be able to manually execute that.
Timing
After players do their individual warmups (bands/weights/plyos), they will do their “every days”, throwing and fielding. This is typically followed by a team warm up, with team captains running the show. Coaches don’t necessarily intervene until 20 minutes into the practice. This allows us to validate the rest of our practice plan and finalize assignments, including the order of bullpens.
Each bullpen consists of 20 pitches and takes about 10 minutes of elapsed time. This includes the player throwing to loosen up a little, resetting all the technology and paperwork, some conference time after 15 pitches and assessment at the end. I keep thinking it can be two throws a minute, but there’s a lot of process around it.
Additional prep
Sometimes, we have a few players allocated to the bullpen session before they toe the rubber there. There are a number of additional tools that they might employ and tasks they might perform to help run a bullpen session.
The easiest tool for us to use is the CleanFuego. Our youth players of any age never have any trouble figuring out how to use the CleanFuego. When I pull it out in a group of old men playing baseball, they spend a lot of thought on how to throw it. It’s honestly as easy as the kids make it. When you throw a pitch with no gyro spin, the ball flies smoothly. When your spin direction is not right, it wobbles. Sometimes, it wobbles crazily. Kids adapt to it in 2 or 3 throws. It’s been great for getting them to impart backspin on their fastballs. So, when we have a couple of extra pitchers getting warm before their bullpen, we break out the CleanFuego.
We expect to start using our Core Velocity Belt this year and I think we will be integrating it into bullpens for warm ups at the start. Having just one Belt, we’ll start cautiously and expand it’s use as we get more comfortable with it.
We also occasionally have players do the tracking. This has ranged from having them just monitor and report on velocity to having them fill out the tracking sheets. As we train them in the process, I do expect that we will eventually be able to have players running the bullpens with coaches able to simply focus on coaching instead of dual-hat work as a data-recorder and coach. When we get to that point, we will likely also run more than one bullpen at a time which will greatly increase our data collection.
The Bullpen Tracking Sheet
Every bullpen is recorded, whether we have technology to provide velocity and other details or not. Simply tracking location, type of pitch and the number of pitches is going to useful over the long haul. In fact, if you don’t want to record or track velocity, just tracking the base data is going to help.
We start by filling out the top part of the bullpen tracking sheet. It’s straightforward to name the pitcher and catcher. Date is also an obvious one.
When I coached Little League, we’d have 2 games a week and I had a pitcher throwing a bullpen every inning. At the start of the season, that pitcher was always the one throwing the next inning. By the end of the season, with players throwing 2, 3 or 4 innings, some of those pitchers were just getting work in. Whether we had 1 or 2 practices in addition to the games, there was never enough practice time. By throwing a bullpen during the game, the player got focused attention and practice one more time. Some coaches will argue that the time is better spent in the dugout learning ‘situational baseball’, but we’d rather have them develop their physical skills whenever we can.
”Record By” was added when it was realized that if a player was marking balls and strikes in the bullpen, they might not have the same criteria as the pitching coach.
The initial version of the sheet didn’t number every pitch, so when left to untrained hands (parents or players) sometimes the pitches weren’t recorded in the order that we expected. So, every cell now has its number from 1-20.
I recommend new pitchers or fielders who may not pitch throw exclusively from the stretch. Learn one thing at a time.
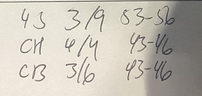
For pitch #5 in this bullpen, the Changeup (CH) was thrown from the windup and came in at 52mph. It started high and inside but finished in the top of the strike zone. Needless to say, this was good movement (GD MVMT). You can mark it any way that makes sense to you. I know my own notations have changed in the last year and will continue to evolve. For example, I’ll likely move that W over below the pitch type.
Not every bullpen is the same, but once the pitcher is loose, we have a quick conference on what the pitches are going to be. We might script 5 pitches of three types (FF, CH, CB) and try to throw 60% from the stretch. With some players, like me, it can 100% from the stretch, for simplicity.
The person recording marks the pitch type and whether it’s from the windup or stretch before each pitch, so everyone is on the same page.
At the bottom of the sheet, there is a section for Session Notes. We record the ball/strike ratio for each pitch type here, showing the velocity range (outliers in parentheses). We add comments about the bullpen session, such as a summary or praise or a cue that might be useful. Since the player gets this paper copy of the sheet, they’re likely to retain it to understand their own capabilities and progress.
At the end of the session, we take a photo of the tracking sheet so it can be loaded onto the iCloud page for that pitcher.
iCloud Notes
We create an iCloud Notes page for each pitcher on our team. As pitch tracking sheets are created, each gets added to the bottom of the page. We add notes on the session, evaluations of the player and plans for future use (in games or in bullpens) at the top of the page. For both sets of information, the most recent image or text is placed at the top to allow quick reference.
Thus far, having them stored on the same page, but with images and text separated seems to provide the most value for us. Since we’ve just had this in use for a single fall season, we’re not yet sure whether to have new pages for new seasons or if all the data for a single pitcher should remain on one iCloud Notes page.
Finally
Hopefully, this gives you a good idea of the logistics, technology and paperwork to set up and record information about your team’s bullpens. I do expect to write more on the process and on what we’ve done when evaluating the data. For me, probably the greatest asset is being able to review objective data and recorded video of our pitchers, rather than just relying on my memory of how well their bullpens went.
As I began using my pitch-tracking sheets, I found that I was feeling a little blind about the pitchers that I had warming up in the bullpen each inning. At my most organized, I had one assistant coach that served as the bullpen coach and I would ask him how the session went. Even though it was recorded using the PitchLogic ball, I wasn’t looking at any data when I considered sending in the reliever.
I had good data collection and some guidelines for number and type of pitches, I was only able to use it in retrospect to do an after-action review of the game and bullpen. I was able to discover and share insights with my pitchers – for example, that a high spin rate from one of my pitchers would coincide with a good outing. I didn’t have them use video because that got a little too complicated. I never knew how accurate they were throwing, other than generalities.
I came up with a basic bullpen pitch-tracking sheet. Room for 20 pitches and comments if necessary. It’s simpler than the pitch-tracking sheet for games, since there are no game details (count, runners, result) to worry about.
I’m now helping at practices with a 13u travel team and brought the sheets to a practice in which we did some short bullpens. The most important thing I learned was that it didn’t have enough guidance to how to fill it out. I had 4 pitchers and they rotated between camera, radar, pitching and the tracking sheet. It was a good session and it got me to improve the bullpen pitch-tracking sheet.
Sheet Header
In the header, it provides space to record your pitcher and catcher, as well as the inning and date for reference. It hadn’t occurred to me until our head coach, Sean Willingham, had a look at it that it was REALLY important to know who filled it out. It will almost always be our players recording the data and some players will record the strike zone far tighter or looser than others. If you don’t have them mark down who recorded the session, you might interpret the results incorrectly. It also forces some accountable when recording.
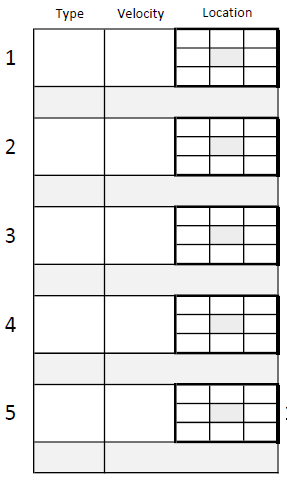
Pitch cells
There are four sets of five pitch cells to allow 20 pitches in a bullpen. While that’s more than I had the 11-year-olds throwing, a little extra seemed merited for older players. For bullpens that happen at practice, 20 pitches feels good for me, even when we’ve got the 14u practicing with us. If they’re throwing a bullpen instead of pitching, it would probably be useful to use two or more sheets. Then, have the pitcher take a break after each sheet, as though he was sitting while his teammates hit. Pairing pitchers on bullpens like this is a good way to simulate game usage.
Pitch type follows the little guide in the upper right (if you prefer FF and FT for 4-seam and 2-seam….) and the next big box is the velocity. Then, the important one for in-game bullpens is the 9 cells for the pitch location. The middle is the strike zone and I prefer they use an X to mark the location, being as granular or vague as their understanding merits. When recording pitches that have good movement, you can always use an arrow to show where it started and where it ended. At the bottom of each pitch cell is a grey box in which a note could be made, like “GRT MVMT” or track the virtual count (2-1, 0-2, etc).
Let me know if you find this useful or if you have editing suggestions. I am probably going to have the good folks over at Always Grind 365 print me some books full of them before the next ABCA. If you’ve read this far, you obviously like recording data on paper like I do, so make sure to check out their Pitcher’s Notebook and Catcher’s Notebook. I use both for myself when I play and will be working with getting our 13-year-olds to try them out this year.